2024 Elections and The Impact on Capital Markets
July 12, 2024
It’s 2024 and it is a presidential election year. Often during meetings clients ask the question, “What will be the impact of the elections on capital markets?” To appreciate historical data sets pertaining to markets during election years, let us first take a quick assessment of the current health of capital markets, and the economy.
The economy is solid but slowing, while capital markets are reasonably healthy. Jobs growth is solid: +272,000 new jobs in May, and unemployment is low at 4% [1]. Inflation has moderated a lot: April 2024 PCE was +2.8% core [2], and May core CPI + 3.4%, compared with + 9% in 2022 in the aftermath of the COVID-19 pandemic [3]. Federal Reserve monetary policy is restrictive with interest rates at 5.25% – 5.5% but Fed Chairman Jerome Powell has repeatedly stated his intention to eventually lower interest rates when inflation data shows further moderation toward the Fed’s 2% target level [4]. Corporate earnings are expected to grow +10% this year, after contracting for three quarters last year [5]. Consequently, the U.S. stock market is rallying with much broader participation among companies in the S&P 500 this year than last year. [6] Investors make a return on their money again, earning approximately 5% interest via low-risk U.S. Treasury bills and bank CD’s [7]. Despite an ugly and disconcerting global geopolitical landscape, the current U.S. economy and capital markets landscape is more favorable and should weigh positively on markets as we approach the November elections.
Historically during presidential election years capital markets tend to behave as follows:
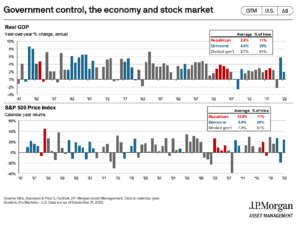
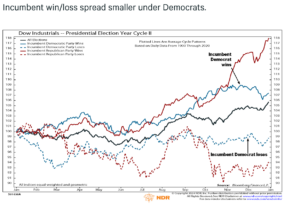
- The economy grows more vigorously when Democrats are in power, while the stock market performs best when Republicans are in power.
- The economy (GDP) grows between +2.7% – +4% and growth is slowest when there is divided government in Congress as is currently the case.
- The stock market (S&P 500 index) has an average gain of + 7.9% when government control in Congress is divided (61% of the time), compared to +9.9% gain when Democrats are in control (29% of the time) and compared to + 12.9% gain when Republicans are in control of Congress (11% of the time). [8] [9]
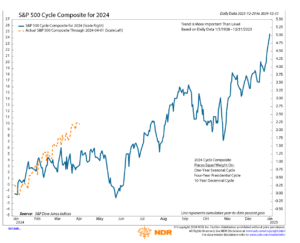
- During presidential election years the S&P 500 index typically rallies during the winter, summer, and fourth quarter as the uncertainty of the election outcome fades; however, pullbacks in the stock market in April – May and September – October are to be expected. [10]
- Approval ratings for the presidential incumbent candidate are revealing: > 50 and the incumbent wins, < 43 and the incumbent loses. [11] Voters’ financial well-being is usually a determining factor when an incumbent President loses re-election. The cumulative hyper- inflation of the past several years has adversely impacted many voters and may prove to be President Biden’s electoral albatross. President Trump’s approval rating in his 4th year was 41. President Biden’s approval rating this year in his 13th quarter in office was 38, the lowest rating of any incumbent President in their 13th quarter in the 70-year history of Gallup polling. [12]
- Although it feels strange this Trump / Biden rematch is not unprecedented. There have been 6 Presidential rematches; most recently in 1956 (Eisenhower / Stevenson) and as early as 1800 (Jefferson / Adams). [13]
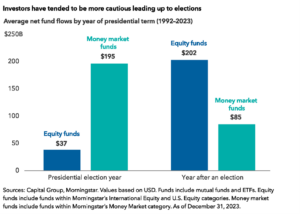
- Asset flows reveal that investors are cautious during Presidential election years, with a strong preference for money market funds; however, post-election investors tend to regain confidence and prefer equity fund investments. [14]
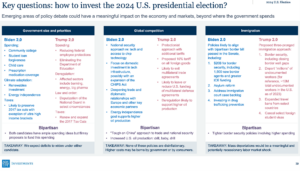
- Not only will corporate earnings and Federal Reserve monetary policy drive capital markets in 2024, but the election outcome should also help investors to assess the landscape for potential government policy changes in 2025. The Trump tax legislation that became effective in 2018 will sunset at the end of 2025. New tax rates (corporate, capital gains, income, estate) SALT deductions, trade tariffs, fiscal policy, and US government deficits will all be impacted.
We encourage clients to not feel overwhelmed by the multitude of considerations, and emotions, that this presidential election presents. Instead, we encourage you to reach out to your advisor to help you calmly navigate this period, and to make thoughtful and informed investment decisions.
References
- S. Bureau of Labor Statistics. (2024, June 7). Employment Situation Summary. [Press release]. Link
- Bureau of Economic Analysis. (2024, May 31). Personal Income and Outlays, April 2024. [Press release]. Link
- S. Bureau of Labor Statistics. (2024, June 12). Consumer Price Index Summary. [Economic news release]. Link
- Federal Reserve. (2024, June 12). Federal Open Market Committee Projection materials, accessible version. [Press release]. Link
- S & P Global (S&P Dow Jones Indices). (2024, May 1). Quarterly Earnings Reports and Updates. [Earnings release]. Link
- (2024, March). S&P 500 Percent of Companies Trading above 200 Day Moving Averages [Chart]. Retrieved on April 1, 2024. Link.
- Wall Street Journal, Dow Jones & Co., Tullett Prebon. (2024, May 1). S. Treasury note yield. Link
- P. Morgan Asset Management. (2023, December 31). Guide to the Markets. “Government control, the economy and stock market.” [Chart]. Link
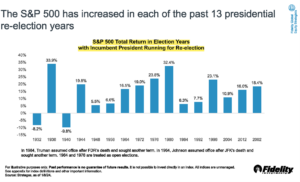
- Fidelity Investments, Strategas. (2024, January 8). Global Equity Outlook. “The S&P 500 has increased in each of the past 13 presidential re-election years,” [Chart]. Link.
- Ned Davis Research. “S&P 500 Cycle Composite for 2024,” [Chart]. Link.
- Ned Davis Research. The 2024 Election Handbook. (2024, February 29). “Biden’s approval rating closer to incumbents who lost than won,” [Chart]. Link.
- (2024, April 26). Biden’s 13th-Quarter Approval Average Lowest Historically. “Elected Presidents’ 13th-Quarter Job Approval Average Ratings,” [Chart]. Link
- The HISTORY Channel. Roos, David. (2024, April 3). 6 Presidential Election Rematches in U.S. History. Link
- Capital Group. Lovelace, Robert W. and Spence, Darrell R. (2024, March 7). Three mistakes investors make during election years. “Investors have tended to be more cautious leading up to elections,” [Chart]. Link
Disclosures: The views contained in this presentation represent the opinions of GYL Financial Synergies, LLC as of the date hereof unless otherwise indicated. This and/or the accompanying information was prepared by or obtained from sources GYL Financial Synergies, LLC believes to be reliable but does not guarantee its accuracy. The article is not a complete analysis of every material fact in respect to any security, mutual fund, company, industry, or market sector. The material has been prepared or is distributed solely for information purposes and is not a solicitation or an offer to buy any security or instrument or to participate in any trading strategy. This document contains forward-looking statements, predictions and forecasts (“forward-looking statements”) concerning our beliefs and opinions in respect of the future. Forward-looking statements necessarily involve risks and uncertainties, and undue reliance should not be placed on them. There can be no assurance that forward-looking statements will prove to be accurate, and actual results and future events could differ materially from those anticipated in such statements. Past performance does not guarantee future results.
CAR20240712GYLECPM